
Why Truck Service Time Is a Core Fleet Metric
A truck that isn’t moving isn’t earning. Fleet managers feel that in the maintenance budget, in driver hours, and in the commitments made to customers, so it pays to know exactly where the non-earning time goes. Do that well and the operation runs lean; skip it and the same trucks cost noticeably more to run.
Three ideas carry most of the weight here. PM inspection hours are the labor a technician spends on scheduled preventive maintenance. Bay time is the whole span from the moment a truck enters a service bay to the moment it is released. Truck downtime cost is what those idle hours actually cost once you count lost revenue, idle drivers, and missed deliveries.
Two trucks or two hundred, the scheduling math works the same way. Fleets that treat quality service and reliability on the road as a scheduling standard rather than something to sort out after a breakdown spend less time on unplanned repairs and lose less revenue. What follows puts numbers on those ideas: PM schedules, bay throughput, and downtime cost you can plan against. Accurate numbers beat guesswork, and guesswork is what quietly erodes fleet margins.
PM Inspection Hours: What the Numbers Actually Look Like
PM inspection hours are the labor a technician spends on a scheduled preventive maintenance service, counted from the moment the truck enters the bay to the final sign-off. They are the most predictable number in any service estimate. Break them out by service tier and a vague “it depends” becomes something you can schedule against.
Most diesel truck maintenance programs sort work into three tiers, A, B, and C, with each tier building on the one below it. Knowing what sits in each tier is the quickest way to see where the hours go.
A Inspections: The Fast, High-Frequency Tier
An A inspection is the lightest service, usually 1.0 to 2.5 hours. The technician works through quick, high-visibility items: coolant, oil, and DEF levels; lamps, wiring, and battery terminals; tire tread depth and pressure; and a general walkaround. Almost none of it is invasive, so A-level PM inspection hours stay low and steady.
B Inspections: Adding Depth to the Brakes
A B inspection adds more invasive work and generally runs 3.0 to 5.5 hours. On top of everything in A, it measures pad and drum wear, replaces filters, and takes a closer look at fluid condition. The brake work alone can double a basic service, which is what pushes B-level PM inspection hours up so fast.
C Inspections: The Comprehensive Service
C is the deepest tier, commonly 6.0 to 10.0 hours or more. It includes everything in A and B, plus engine diagnostics, full brake service, and driveline and chassis inspection. Engine diagnostics are open-ended by nature, so estimates spread widest here.
| Service tier | Representative scope | Typical PM inspection hours |
|---|---|---|
| A inspection | Fluid checks, lighting and electrical checks, tire wear assessment, visual walkaround | 1.0 to 2.5 |
| B inspection | A tasks plus brake inspection, filter replacement, fluid condition review | 3.0 to 5.5 |
| C inspection | B tasks plus engine diagnostics, full brake service, driveline and chassis inspection | 6.0 to 10.0+ |
Why the Hours Vary by Truck Class and Duty Cycle
The ranges above are representative, not fixed. A Class 8 tractor carries more systems, larger fluid capacities, and heavier brake and tire components than a Class 6 straight truck, so every line item takes longer. Duty cycle matters just as much. Stop-and-go regional routes wear components faster than long-haul running, and severe-duty work such as construction, refuse, or extreme temperatures calls for shorter service intervals and longer inspection scopes. Two fleets on identical preventive maintenance schedules can therefore log very different PM inspection hours.
A shop that’s serious about quality truck service and reliability on the road can help hold these ranges steady and take some of the guesswork out of the plan.
Numbers like these are what make a maintenance plan defensible. The checklist below breaks out the tasks that drive PM inspection hours at each service tier, so scope, schedule, and budget line up.
Standard PM Inspection Components and Typical Hour Weight
A standard PM inspection is a bundle of smaller jobs. Know the hour weight of each one and you can estimate total bay time quickly. The figures below are typical averages for a Class 8 tractor with a diesel engine; real PM inspection hours shift with shop layout, technician skill, parts availability, and whether the truck arrives road-ready or already overdue for repairs.
- Fluid and filter service – Draining, refilling, and filter swaps for engine oil, coolant, transmission, and differential; typically 2.0-3.0 hours.
- Brake and air system inspection – Pad, drum, and slack adjuster checks plus air line, compressor, and dryer testing; roughly 1.5-2.5 hours.
- Tire and wheel inspection – Tread depth, pressure, sidewall condition, and torque checks across every position; about 0.5-1.0 hour.
- Lighting and electrical systems – Headlights, marker lamps, batteries, alternator output, and wiring continuity; around 0.5-1.0 hour.
- Engine and aftertreatment diagnostics – Fault-code scans, DPF and DEF checks, EGR review, and performance verification; approximately 1.0-2.0 hours.
- Chassis and suspension review – Springs, shocks, kingpins, driveline, and frame inspection for wear or cracking; typically 1.0-1.5 hours.
- Documentation – Logging findings, updating service records, and flagging follow-up work; roughly 0.25-0.5 hour.
Added up, those items come to roughly 7 to 11 PM inspection hours before any corrective repair begins. With consistent, quality truck service behind the estimate, “how long will it take?” turns into a downtime budget you can defend.
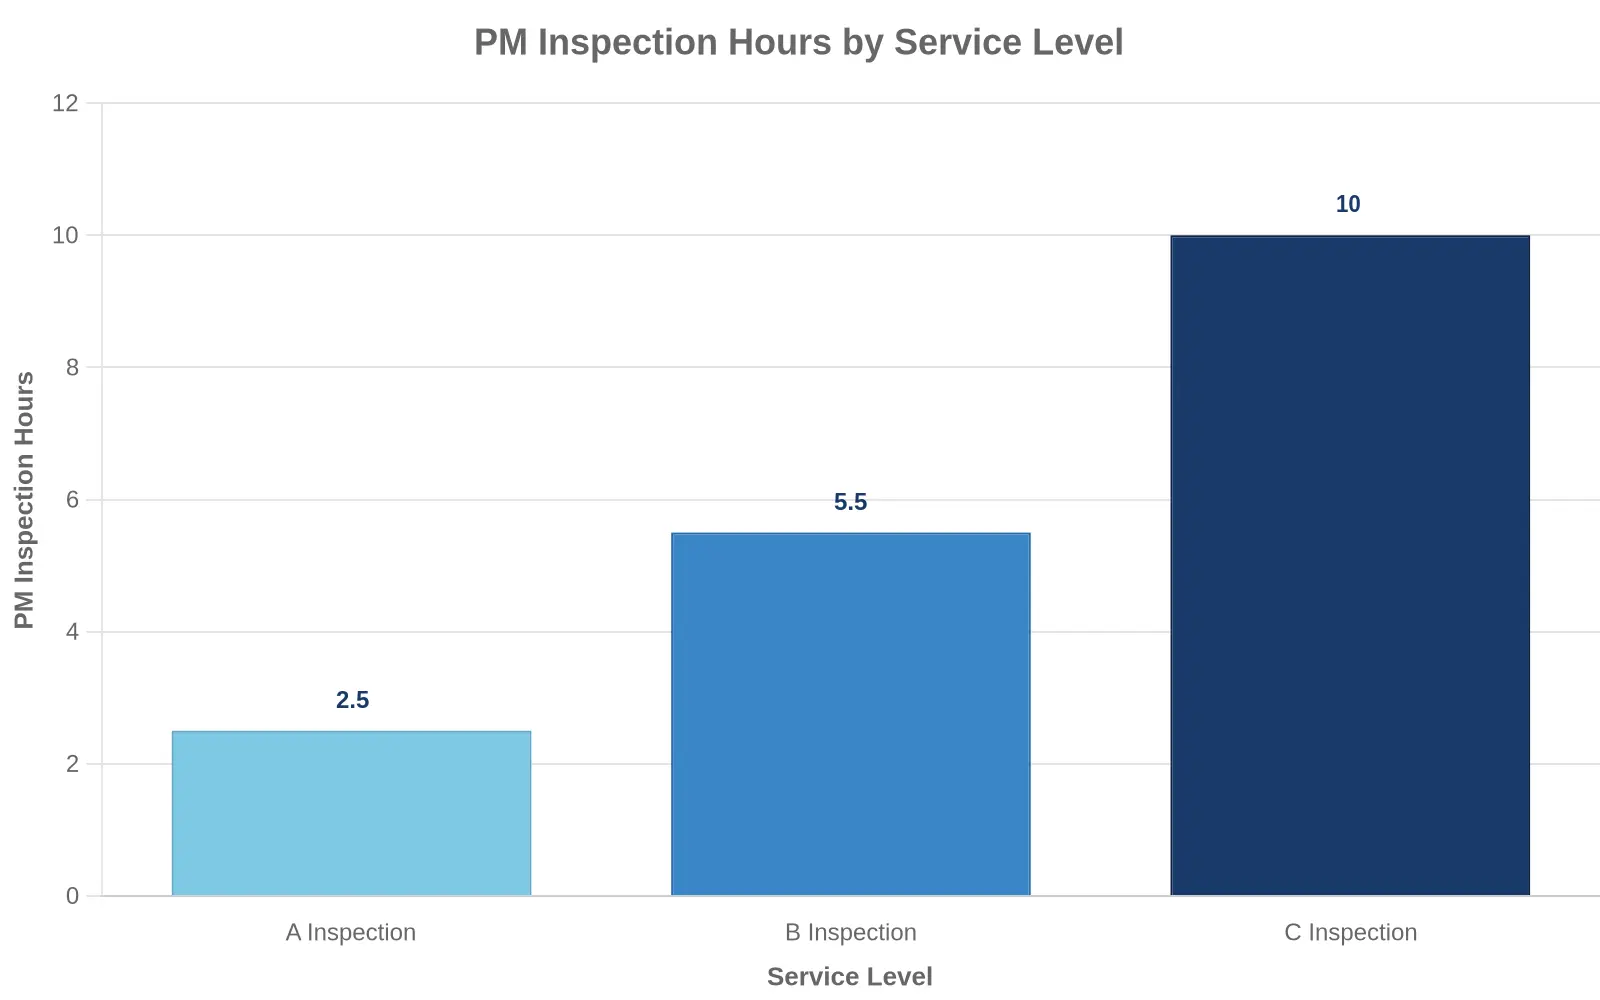
Estimated PM inspection hours for each major service level, A, B, and C. The bars don’t climb evenly: an A inspection runs about 2.5 hours, a B inspection about 5.5 hours, and a C inspection about 10 hours, so stepping up one level can more than double the time in the bay. Because truck service time and bay time scale with that depth, put C-level intervals in dedicated bays and blocks instead of squeezing them into short A-level service windows.
Bay Time: From Arrival to Release
Bay time is the full span a truck occupies a service bay, from rolling through the shop door to being released back to the road. It constrains a shop more than anything else, because one bay holds one truck. And it isn’t just the work you pay for – it’s the clock that keeps running while that bay stays occupied.
Two related metrics get confused with bay time, so keep them separate:
- Wrench time is the hands-on labor a technician spends physically working on the vehicle.
- PM inspection hours capture only the time consumed by preventive maintenance checks and procedures.
Bay time sits above both. A truck can occupy a bay for six hours while logging only three hours of wrench time, and a PM inspection may be just a slice of the total truck service time. Track the wider span: idle waiting, not labor, is what quietly inflates downtime.
The Phases That Make Up Bay Time
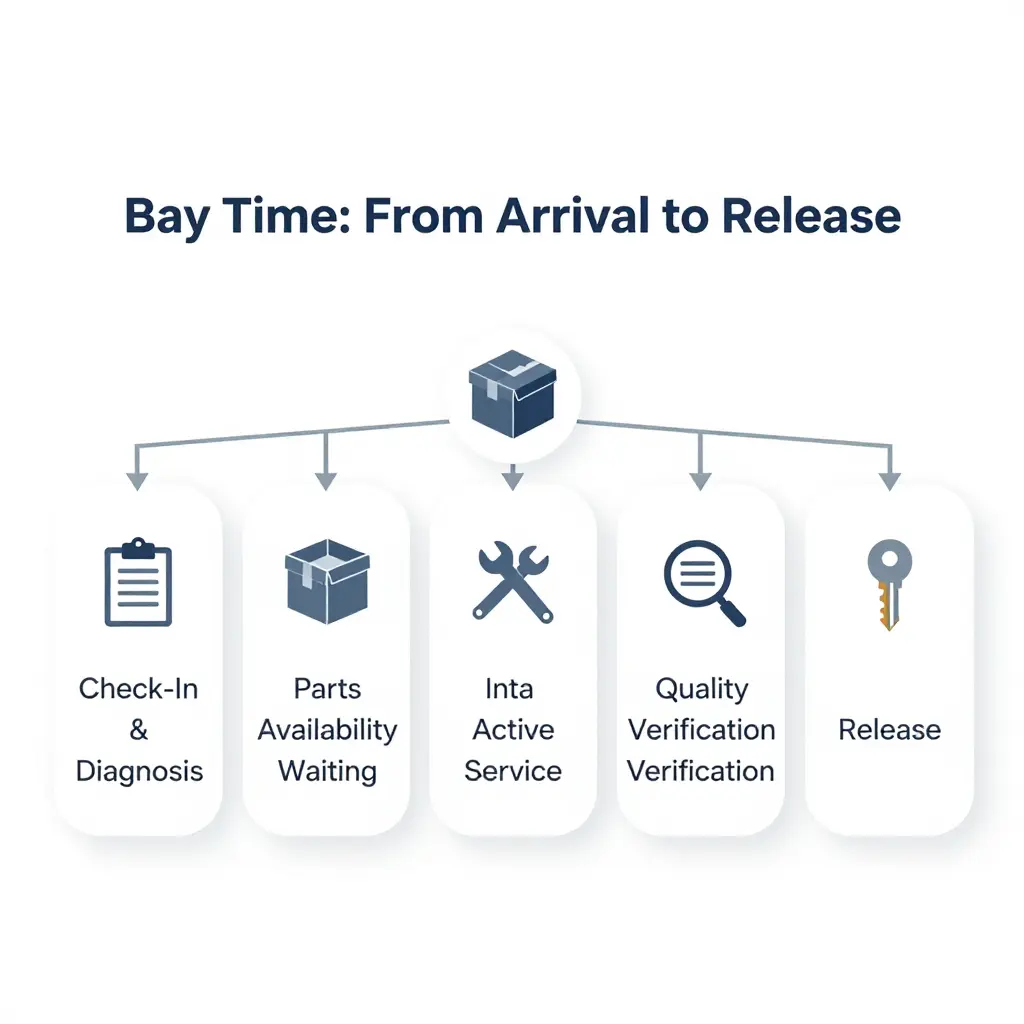
Bay time runs through five phases in sequence, and any one of them can stretch the total on its own:
- Check-in and diagnosis – intake, documentation, and fault isolation.
- Parts availability waiting – the wait between diagnosing a need and having the correct component in hand.
- Active service – the wrench time itself.
- Quality verification – road test, torque checks, and sign-off.
- Release – final paperwork, billing, and returning the truck to the driver.
Representative Bay Time Ranges
Indicative bay time ranges for common PM and repair jobs. Actual figures vary with shop layout, parts inventory, and technician availability.
| Job Type | Typical Bay Time Range |
|---|---|
| Standard PM (A/B service) | 1.5 to 3 hours |
| Full PM with DOT inspection | 3 to 5 hours |
| Brake job (per axle) | 3 to 6 hours |
| Diagnostic and electrical troubleshooting | 2 to 8 hours |
| Clutch replacement | 8 to 16 hours |
| Major repair or engine overhaul | 40 to 80 hours |
How Bay Time Drives Scheduling Decisions
Bays are finite, so even small reductions in bay time add up to real capacity gains across a fleet. Managers use these ranges to stagger PM work, reserve dedicated quick-service slots, and pre-stage parts before a truck ever arrives, collapsing the parts-availability phase that otherwise dominates total truck service time. Owner-operators apply the same logic to negotiate turnaround windows and route revenue miles around predictable shop visits.
Plan by bay time, not just wrench time, and schedulers protect throughput and avoid the surprise overtime that follows an overrun. For teams that need dependable turnaround, a provider recognized for quality service and reliability on the road makes those scheduling decisions easier to turn into consistent uptime.
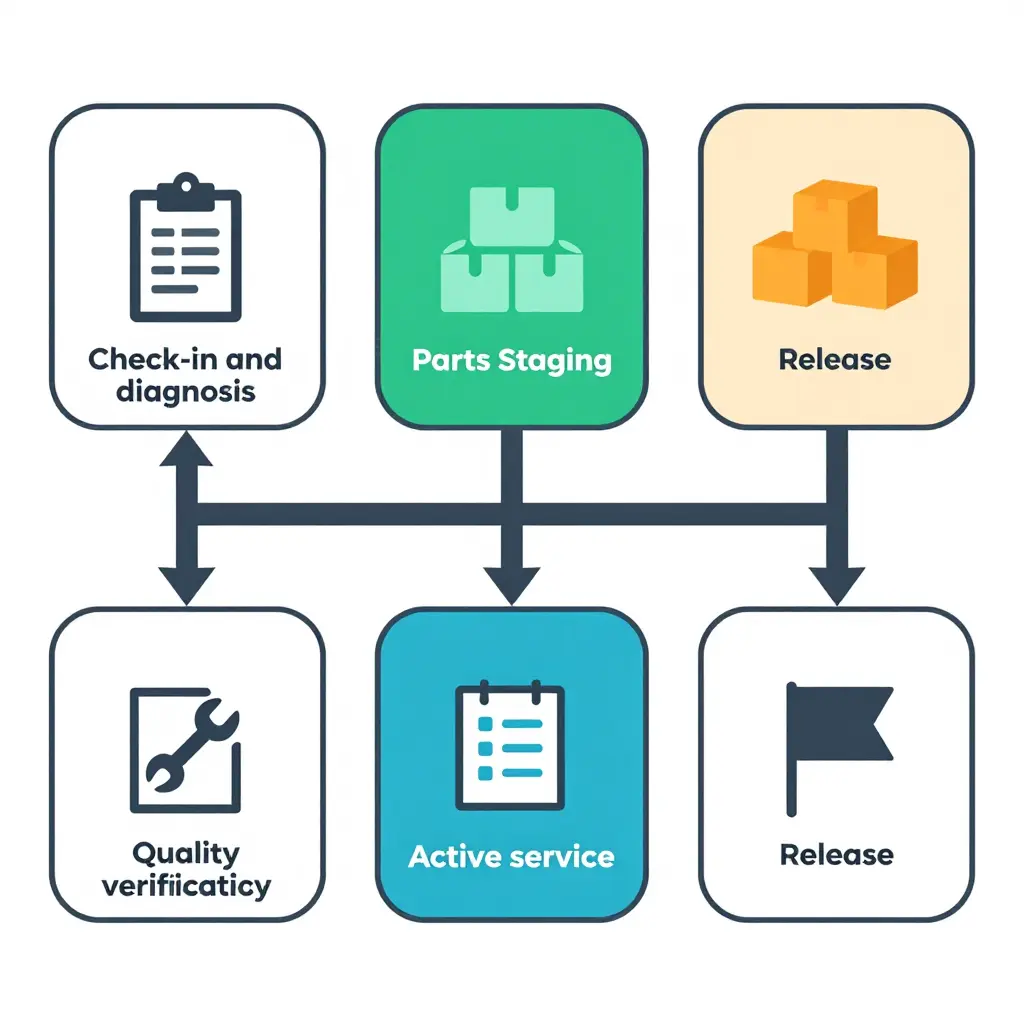
The five phases – check-in and diagnosis, parts staging, active service, quality verification, and release – add up to total bay time.
Service Time Comparison at a Glance
Typical PM inspection hours, total bay time, and the dominant cost driver for the most common truck service events, in one quick reference for scheduling and downtime planning.
| Service Type | Typical PM Inspection Hours | Typical Bay Time | Primary Cost Driver |
|---|---|---|---|
| A Inspection | 2 – 4 hours | 4 – 6 hours | Labor hours and fluid top-offs |
| B Inspection | 4 – 6 hours | 6 – 10 hours | Expanded component checks and part replacement |
| C Inspection | 6 – 10 hours | 10 – 16 hours | Comprehensive diagnostics and scheduled parts |
| Brake Service | 3 – 5 hours | 6 – 12 hours | Brake component parts and axle-down labor |
| Major Repair | 8 – 16 hours (diagnostic hours) | 40 – 80+ hours | Parts cost, specialized labor, and extended downtime |
How to read this table: Truck service time has to be read on two levels. PM inspection hours capture just the technician’s hands-on work, while bay time reflects the full window the unit occupies a service bay, including diagnosis, parts sourcing, and quality checks. For downtime planning, budget against bay time rather than inspection hours alone, since it is bay occupancy that drives lost revenue and the true cost of a truck sitting idle. Map your PM interval mix against this table to forecast service capacity, stagger inspections to smooth workload, and reduce the margin lost to unplanned downtime. To see how reliable, structured service programs keep these bay windows tight, explore quality service and reliability on the road.
Calculating the True Cost of Truck Downtime
The repair invoice captures only part of the cost. What matters to a fleet owner is the total economic drag of a truck sitting still. Putting a number on truck downtime cost takes a formula clear enough to act on, so bay scheduling and preventive maintenance rest on evidence rather than intuition.
The Transparent Formula
Truck downtime cost = Lost Revenue per Day + Labor & Fixed Cost Carry + Repair & Bay Cost
Every piece of that is measurable. Summed across the days a unit is unavailable, the formula converts truck service time into a dollar figure management can act on.
Component 1: Lost Revenue per Day
Start with the gross margin the truck would have produced. A tractor running 500 loaded miles per day at $2.40 per mile generates roughly $1,200 in revenue, or approximately $800 after variable costs such as fuel and tolls. That $800 is the daily revenue at risk whenever the truck is out of service.
Component 2: Labor and Fixed Cost Carry
Fixed costs keep running whether or not the truck rolls. Driver wages, insurance, loan or lease payments, and permits often total $500-$700 per day. These costs are “carried” during downtime: they are paid but not recovered through revenue.
Component 3: Repair and Bay Cost
Direct service cost covers parts, technician labor, and the bay rate. A typical diagnostic and repair event runs $150-$200 per hour in shop time, plus the opportunity cost of occupying a bay that could serve another unit.
Putting the Numbers Together
Representative figures give a working daily rate:
| Cost Component | Daily Value |
|---|---|
| Lost revenue (contribution margin) | $800 |
| Labor and fixed cost carry | $600 |
| Repair and bay cost (allocated) | $900 |
| Total truck downtime cost per day | $2,300 |
A one-day event runs about $2,300. The next question is how that figure compounds the longer a truck stays in the bay.
How Downtime Cost Scales with Bay Time and PM Inspection Hours
Downtime cost scales almost linearly with bay time. Every additional day adds the full daily rate, so a three-day repair reaches roughly $6,900, and a five-day event approaches $11,500. That is why fleet maintenance planning treats bay time as a financial variable, not just a scheduling one.
PM inspection hours amplify the effect because inspection time consumes bay capacity. A four-hour PM inspection scheduled within a ten-hour bay day removes 40% of that bay’s productive capacity, raising the true truck service time cost even when no repair is required. Stretching PM intervals to save inspection hours typically backfires: deferred maintenance lengthens future bay time and inflates the very downtime cost the fleet tried to avoid.
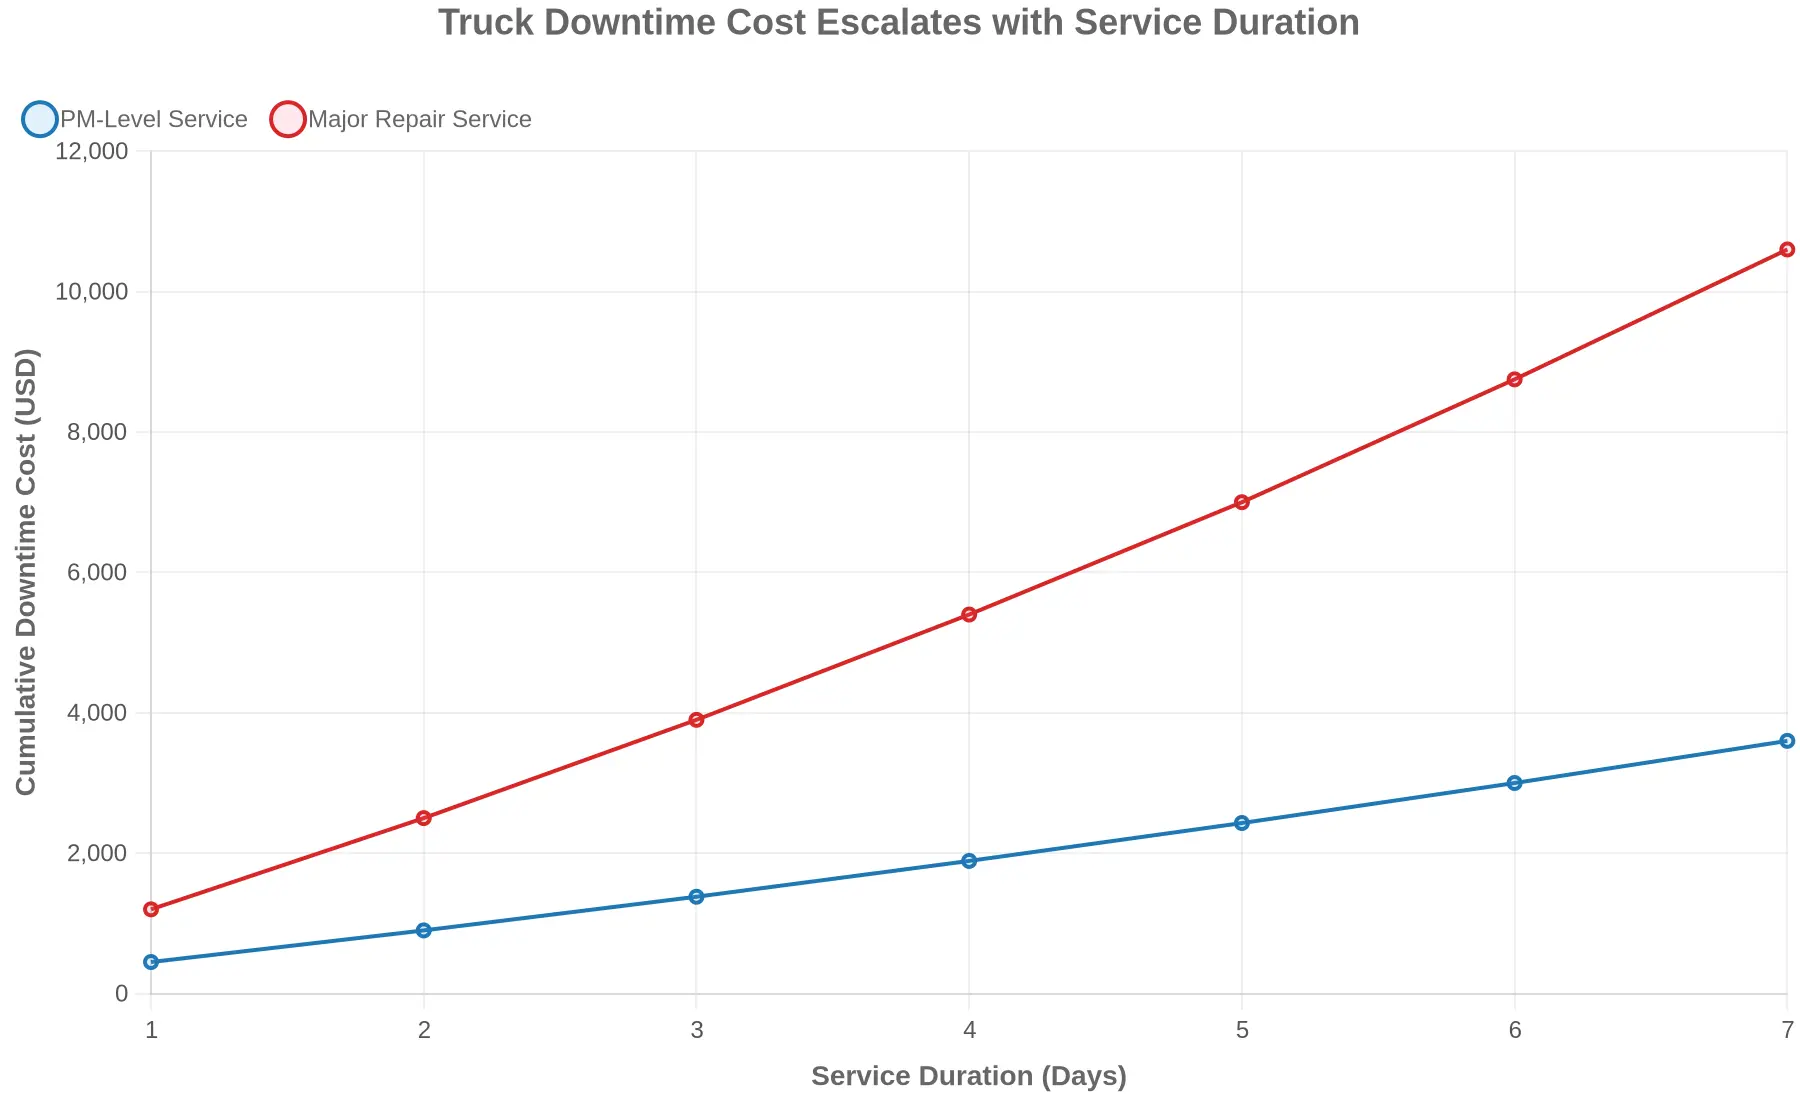
Figure: Cumulative truck downtime cost as service duration grows from 1 to 7 days, comparing PM-Level Service against Major Repair Service.
What This Trend Tells You
The chart is blunt about one thing: the two lines don’t stay parallel. Both climb, but the gap between them widens with every extra day in the bay.
- PM-Level Service (blue line) climbs gradually – from roughly $450 after a single day to about $3,600 by day seven. This is the managed cost of planned, preventive work.
- Major Repair Service (red line) climbs far faster – from about $1,200 on day one to over $10,600 by day seven, as lost revenue, idle drivers, missed loads, and expedited parts stack up together.
The Takeaway for Fleet Decision-Makers
By day seven, a major repair is costing you roughly three times what a PM service would. That gap is the business case for two priorities:
- Tighter PM inspection hours – Catching wear during routine prevention keeps your trucks on the blue line instead of the red one. A few extra inspection hours today is cheap insurance against a $10,000 week tomorrow.
- Faster bay turnaround – Every day you take out of the service bay moves you left on the X-axis, and left is always cheaper. Cutting bay time is one of the highest-leverage cost controls a fleet has.
The cheapest repair is the one you plan for, and the cheapest day in the shop is the one you don’t spend there. Quality service and reliability on the road is how a disciplined maintenance culture protects the bottom line.
Hidden and Indirect Downtime Costs
Most fleets calculate downtime using the obvious math: repair invoice plus lost revenue per day. That number is real, but it is incomplete. The true truck downtime cost also carries indirect losses that never appear on an invoice, and they often outweigh the visible ones. Each hidden cost below comes down to how long a truck actually sits idle, which is why controlling truck service time and bay time is the fastest lever you have over total cost.
Deferred Loads and Missed Delivery Windows
When a truck enters a bay, its scheduled loads do not disappear. They get deferred, and deferred freight has a habit of cascading. A single missed window can push a load onto a re-booked pickup, add a day of transit, and damage a shipper’s on-time scorecard. That loss scales with delay length, not with repair price. Shaving an hour off truck service time can mean the difference between catching a window and losing the account.
Driver Idle and Reassignment Cost
A parked truck idles its driver too. Drivers on standby still earn, and reassigning them to another unit triggers relay costs, unfamiliar-route inefficiency, and HOS-restart risk. These expenses climb in step with bay time, because every extra hour a driver waits is an hour not generating revenue. An owner-operator eats this directly; a fleet spreads it across dispatch.
Contract Penalty Exposure
Many shipper contracts carry on-time performance clauses with financial teeth. Missed windows trigger chargebacks, tender rejections, or renegotiated rates. Unlike fuel or labor, penalties are binary: you either hit the window or you pay. That makes predictable truck service time a contract-protection tool, not just a maintenance metric.
Lost Fleet Utilization
Every day a unit is down, your fixed costs keep accruing. Insurance, financing, and depreciation do not pause for a repair order. That drives your effective cost-per-mile up across the remaining fleet and quietly erodes margin. Protecting fleet uptime is a financial strategy as much as an operational one, and dependable service partners make it easier. You can learn how 5 Star Truck delivers reliability on the road.
Accelerated Wear from Compressed Maintenance Windows
Rushing PM work to free a bay often means skipped steps and deferred small fixes. Those shortcuts reappear as premature failures, which return the truck to the shop sooner. The result is a cycle where compressed truck service time today creates longer bay time tomorrow.
These indirect costs never show up on the repair invoice, but they scale with time in the bay.
Quick Reference: The Five Hidden Costs
| Hidden Cost | Core Driver | Tied To |
|---|---|---|
| Deferred loads & missed windows | Delay length | Truck service time |
| Driver idle & reassignment | Hours parked | Bay time |
| Contract penalty exposure | On-time failure | Truck service time |
| Lost fleet utilization | Idle fixed costs | Fleet uptime |
| Accelerated wear | Rushed PM work | Bay time |
Together, these indirect layers turn a routine PM visit into a decision about how tightly you manage bay time and service scheduling.
Strategies to Reduce Service Time and Downtime
Reducing truck service time and downtime takes a deliberate approach to fleet maintenance. The strategies below target both service duration and downtime cost.
Standardize Preventive Maintenance Schedules
A disciplined maintenance calendar built around fixed mileage or engine-hour intervals replaces reactive repairs with planned service. Standardization removes guesswork, spreads workload evenly across service lanes, and stops small faults from escalating into roadside failures. The expected effect is fewer emergency repairs, shorter average truck service time, and a lower cost-per-mile, because unplanned downtime is the most expensive downtime.
Pre-Stage Parts to Cut Bay Time
Bay time is frequently lost not to labor, but to waiting. Pre-staging the filters, fluids, belts, and wear components required for each scheduled service means the technician begins work the moment the truck is parked. Programs that emphasize proactive parts and product support, such as those detailed in maximizing apparatus uptime through product support, show how ready access to the right components keeps assets rolling. The payoff is a direct reduction in bay occupancy and higher daily throughput per lane.
Tier Inspections by Duty Cycle
Not every truck works the same way. Long-haul, regional delivery, and heavy vocational assets accumulate stress at different rates. Tiering inspections by duty cycle lets planners apply aggressive checklists to hard-working trucks while easing the burden on light-duty units. This targeted approach keeps the fleet maintenance budget efficient and spends inspection hours where they reduce risk the most.
Track PM Inspection Hours Against Benchmarks
Record actual PM inspection hours and compare them to internal or industry benchmarks, and inefficiencies in tooling, staffing, or scheduling show up fast. Once gaps are visible, teams can set realistic targets and hold vendors accountable. The effect is a tighter, more predictable service window and fewer surprises in the downtime equation.
Plan Service Windows Around Utilization Peaks
Scheduling maintenance during naturally low-demand periods, such as weekends or seasonal lulls, keeps revenue-producing hours intact. Aligning service windows with utilization data lets a fleet absorb routine work without sacrificing capacity. Partnering with a provider recognized for quality service and reliability on the road, such as 5 Star Truck Inc, can make those windows easier to secure and complete on time.
Summary of Strategic Impact
| Strategy | Core Rationale | Expected Effect |
|---|---|---|
| Standardized PM schedules | Replace reactive repairs with planned service | Lower truck service time and cost |
| Pre-staged parts | Eliminate waiting at the bay | Reduced bay time, higher throughput |
| Tiered inspections | Match effort to duty cycle | Efficient fleet maintenance spend |
| Benchmarked PM hours | Expose and fix inefficiencies | Predictable service windows |
| Utilization-based scheduling | Protect revenue hours | Less lost capacity, lower downtime cost |
Applied together, these strategies shift maintenance from a reactive cost center into something controllable that protects both uptime and margin.

How total truck downtime cost is assembled from its components: lost revenue, plus labor and fixed carry, plus repair and bay cost, plus indirect costs.
Conclusion: Turning Truck Service Time Into a Controlled Operational Process
The point running through this guide is simple: what determines how long a truck stays off the road is measurable, not unknowable. Both PM inspection hours and the bay time a unit occupies during service are quantifiable inputs, and each one feeds directly into the total truck downtime cost a fleet absorbs. When these figures are tracked rather than estimated, the connection between planned maintenance and lost revenue stops being abstract and becomes a number that can be actively managed.
Accurate planning turns service from a cost center into a controlled operational process. Schedules built on realistic labor estimates and genuine bay availability keep fewer assets idle, limit emergency repairs, and keep vehicles producing revenue instead of sitting still. That is the value of a data-driven maintenance approach for fleet managers, fleet owners, and owner-operators alike: it substitutes evidence for guesswork and gives decision-makers benchmarks they can act on with confidence.
A few takeaways are worth carrying forward:
- Measure truck service time consistently, so trends become visible across weeks and months rather than isolated events.
- Plan against real capacity, matching scheduled work to the technicians and bays that are actually available.
- Treat every service event as a source of data that sharpens future estimates.
- Review downtime figures regularly to expose inefficiencies before they compound.
Maintaining quality service and reliability on the road depends on exactly this kind of discipline, and the operators who build it into their routines are the ones who protect both uptime and margin.
The case ahead is straightforward, too. Continuous measurement is not a one-time project but an ongoing practice. Fleets that commit to refining their maintenance data will steadily shorten service windows, control costs, and convert what was once an unpredictable expense into a predictable, optimized part of daily operations.